
Fourier and Filter Diagrams
18 Jan 2014Progress: Completed
It was suggested that the Reverse Oscilloscope could be used as an educational tool, so I thought I'd make a little standalone widget to demonstrate Fourier transforms and simple filtering. You may know what a low-pass filter does in theory, but I find having a visual idea of what it does makes things a lot more intuitive.
To start, just draw a waveform in the top left box. You might want to start with a step function. Its Fourier transform is shown in the box to the right. Then you can play with the sliders and see its effects.
(Note that this page was laid out for viewing on a large resolution monitor, if your screen is on the small side it will all bunch up into a mess.)
Draw a wave in the box on the left. The box on the right shows its frequency spectrum. Below, the wave and its spectrum are shown after passing through a filter.
Filter:
Frequency
Resonance
Filter:
Frequency
Resonance
I then thought it might be useful to see all four filters at once.
Draw a wave in the box on the left. The box on the right shows its frequency spectrum. Below, the wave is passed through various filters.
Frequency
Resonance
Frequency
Resonance
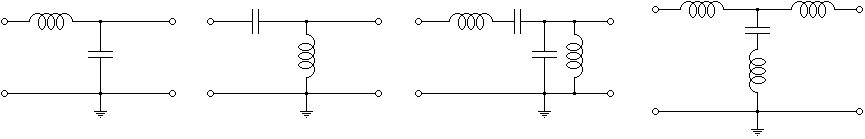
Low Pass
High Pass
Band Pass
Notch
And finally I thought it might be fun to have them all squished onto the one canvas. This isn't all that useful but it looks kinda cool.
Draw a wave in the box. Filtered signals are superimposed in colour.
Lowpass
Highpass
Bandpass
Notch
Frequency
Resonance
Frequency
Resonance
You'll notice I haven't put axes on any of the graphs. Well - these signals could represent anything. It could be sound attenuated by air, an electrical signal through an LCR circuit, or even the motion of a rocking horse on a boat. The x-axis needn't even represent time; it could be a spatial wave. Could it perchance describe the hydrodynamic buckling of a fluid stream, with the parameters corresponding to Reynolds and Bond numbers? It might!