Controlling Old Tech Over a Serial Connection
11 Feb 2015Progress: Complete
I needed to plot some capacitance/voltage curves for a bunch of components. I had access to an RLC300 which can measure capacitance but the bias voltage needs to be applied/swept manually. This is tedious. I thought it was fairly trivial to control it over a serial connection to automate the process but some people were surprised I got it to work, so here's a guide as to what I did.
I couldn't find a remote-controllable power supply, but did find an arbitrary waveform generator with a serial port. This can be set to DC mode with variable offset and works fine. It is limited to +/-10V but that's enough for my needs. You could potentially amplify it, as the RLC300 has an internal voltmeter.
The physical connection is a dual USB-to-Serial adapter, followed by additional serial cables to the devices. The RLC300 has a 25-pin port, so finding a lead with both 9-pin and 25-pin plugs is a bonus. Most female-female 9 pin cables are null-modem (crossover) which is not what we want. Pins 2 and 3 will be swapped in that case. The best way to work out what's going on is to send junk data down the cable and watch the pins on an oscilloscope. If you have it connected right, the device will start to say "Illegal Command" on its LCD.
On my Windows machine the ports appeared as COM10 and COM11. Beware, sometimes unplugging and replugging the USB adapter will reassign these. You can send to a serial port from the command line like
echo hello > COM10 but a tool like bray's terminal makes testing the setup a lot easier.You can choose on the menu screen of the RLC300 what protocol to use, RS232 with the default settings works fine. The commands over GPIB are different to those over RS232. To enable remote control, the command according to the manual is REN, but over RS232 the REN command is represented as a single byte $09. There is an example program written in QBASIC in the manual which clears this up a little, excepting the fact that there are typos in it. Some of the Ascii commands have to be prefixed with an asterisk. All commands are only processed when the device receives an LF (\n, $0A). The RLC300 takes a moment (sometimes several seconds) to make the measurement, so explicitly set the timeout to be large.
The arbitrary waveform generator was much simpler to interact with, all commands are plain text.
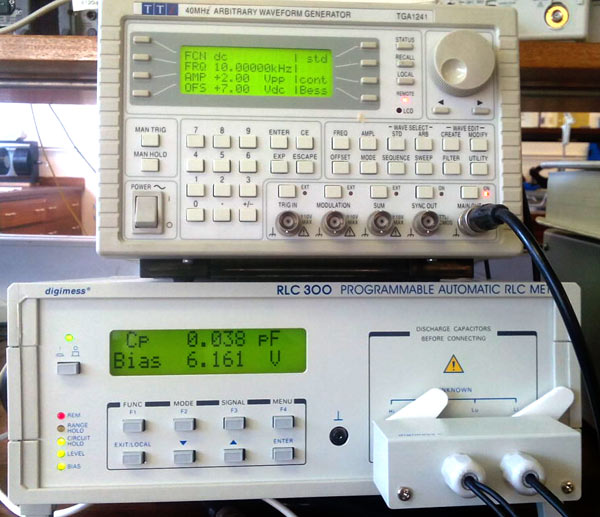
Wave gen's 'Main Out' BNC lead is connected to the bias input on the back of the RLC300.
I'm not a huge fan of Python but it makes sense in this situation. The code is just a matter of connecting, resetting, and then sweeping the voltage while triggering capacitance readings. We split the response string into numbers so that we can plot a pretty graph, and also write the data to a text file. In Python 3, strings are unicode by default so we have to explicitly cast everything to ascii.
import serial
import time
import numpy
import matplotlib.pyplot as plt

waveGen = serial.Serial(9) #COM10
rlc300 = serial.Serial(10, rtscts=1,timeout=30) #COM11

waveGen.write(b"OUTPUT ON\n")
waveGen.write(b"WAVE DC\n")
waveGen.write(b"DCOFFS 0\n")

rlc300.write(bytes(chr(20)+chr(9)+chr(25)+"*RST;*CLS\n",'ASCII'))
rlc300.write(b"FREQ 10000;LEVEL_LOW\n")
rlc300.write(b"MODE_CD;MON_BIAS\n")
rlc300.write(b"BIAS_EXT;CIRC_PAR\n")

name=input('Filename: ')
file=open(name+'.txt','w')
file.write('Bias [V]\tCapacitance [pF]\n')

bias=numpy.arange(-5,11,float(input('Step size [V]: ')))
cdata=[]
vdata=[]

for n in bias:
    waveGen.write(bytes("DCOFFS "+str(n)+"\n",'ASCII'))
    time.sleep(0.05)
    rlc300.write(b"*TRG;C?;MON_B?\n")
    response = str(rlc300.readline()).split(';')
    c = float(str(response[0])[4:])
    v = float(str(response[1])[2:-5])
    file.write(str(v)+'\t'+str(c)+'\n')
    cdata.append(c*1e12)
    vdata.append(v)
    print(v,c*1e12)

file.close()
rlc300.close()
waveGen.close()

plt.plot(vdata,cdata,'.',vdata,cdata,'k')
plt.title(name)
plt.ylabel('Capacitance [pF]')
plt.xlabel('Bias [V]')
plt.axis([-2,10,0,100])
plt.show()
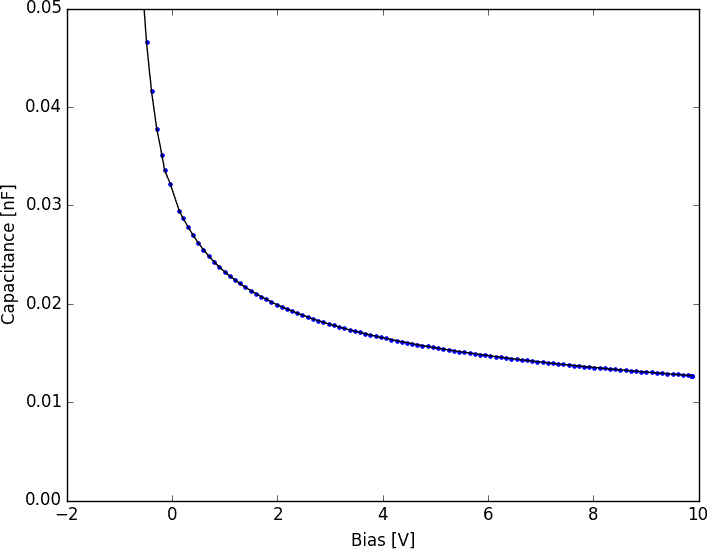
Press Run, and a minute later a beautiful CV curve pops up. This is an LED in reverse bias, showing a perfect 1/C³ relationship.