
Analemmagraph
26 Sep 2023Progress: Concept
Like most people interested in photography, I've dabbled my fair share in making timelapses.
One of the more interesting timelapse-related ideas is the solargraph. I first saw the examples by Justin Quinnell over a decade ago. A single six-month exposure with a pinhole camera, from solstice to solstice, plotting the path of the sun. If you image search for solargraph there are some great examples.
Part of the appeal is not just the super-wide distortion of the curved image plane but the patchiness of the sun trails. On cloudy days they're hidden.
At one point in my life, I lived in a tower block in west London and I always regret not doing a solargraph out of the window. I did a bunch of timelapses from that window, but I every time I remembered about the solargraph I would say oops, well, I'll wait for the next solstice. It never happened!
Years later and a friend of mine moved into a tower block with a fantastic view of London, and I spent some time pestering him to try and do one. We did ultimately set up a raspberry pi to make some timelapses of the changing London skyline, but it wasn't really the same.
Part of the problem with doing it digitally is that digital sensors have nowhere near enough dynamic range. A six month exposure is obviously out of the question, but even stacking thousands of shorter exposures has its problems. Daylight has such an enormous dynamic range. It may just about be possible, using a raspberry pi camera, to create a solargraph, but you would have to carefully track the automatic exposure and compensate for it when you stack the images.
There's so little dynamic range in a regular digital sensor that you can't even capture everything in a single shot. If we want a clear outline of the sun, as a dot, we can have no other details in the image. I think the best option would be to set up multiple cameras, with different ND filters over each one (i.e. sunglasses) to try and do a super-HDR image. They'd need full manual control and the whole thing would need to be logged for six months, but then – then! – we'd have data for solargraphs and more.
Stacking all the images into a single frame is one thing, and playing back the frames as a video is another. But another thing you could do is plot analemmas. This is the characteristic figure-8 shape of the sun's position, for a fixed location, at the same time each day, throughout the year. To draw an analemma, you would simply skip through the data to extract images at, say, noon each day, and stack them into a single frame.
But beyond this, we have the data to draw an analemma for any time of day. I immediately thought that the most interesting way to present this would be to construct a video, where each frame is an analemma, animated from morning to evening. I love doing this type of thing (there are several projects I never posted which revolve around similar themes) but the requirement for a good view, and a whole year of images, means I'm unlikely to ever acquire the data to do it.
Unless....?
Faking it
Why do we need to go outside, when we live in an age of computers? We can simulate the great outdoors just fine.I thought it would be a fun and interesting challenge to simulate the position of the sun, for a given latitude and longitude, but I suppose I shouldn't have been surprised to learn that this has been done before. It's a very solved problem, so much so that there's an add-on for Blender that does it all for you.
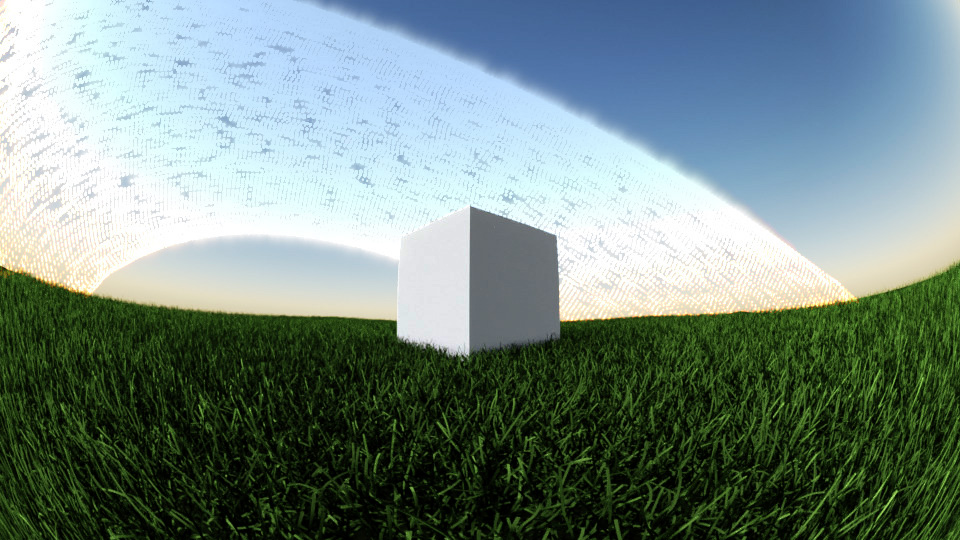
I enabled the sun position add-on and linked it to a sky texture. There's a choice of algorithms for sky texture but the default (Nishita) seems fine. My scene consists of a white cube on a plane. To make it seem a bit more outdoorsy I put some grass on the plane. (Hair particles in green.)
I set the latitude to 51° and, to try and capture some of the solargraph effect, went with a big fisheye lens, and rendered a day.
I think this is a surprisingly good result for the amount of effort it took. However, there's a few things holding us back, not least of which is that if we wanted to render a full year's worth of images, that would probably take a whole year to render anyway. (This is only a slight exaggeration: if each frame takes ~45 seconds to render, then rendering one frame for each minute of a year would take about nine months.)
The simulated atmospheric effects (dust etc) and the limited dynamic range mean the position of the sun is quite hard to make out. But there are parameters in the sky model that let us reduce the bloom, and it is at least easy enough to adjust the brightness on our virtual sun.
Another problem is that the fisheye projection doesn't map at all to the type of layout a solargraph gives you. The pinhole canister gives a rectilinear projection in the vertical plane, but a fisheye-type panorama in the horizontal plane. This gives the distinctive hump shape to the sun path. I'm not sure we can simulate that in Blender without resorting to writing our own shaders. I switched to an ultrawide rectilinear projection to see how it compares.
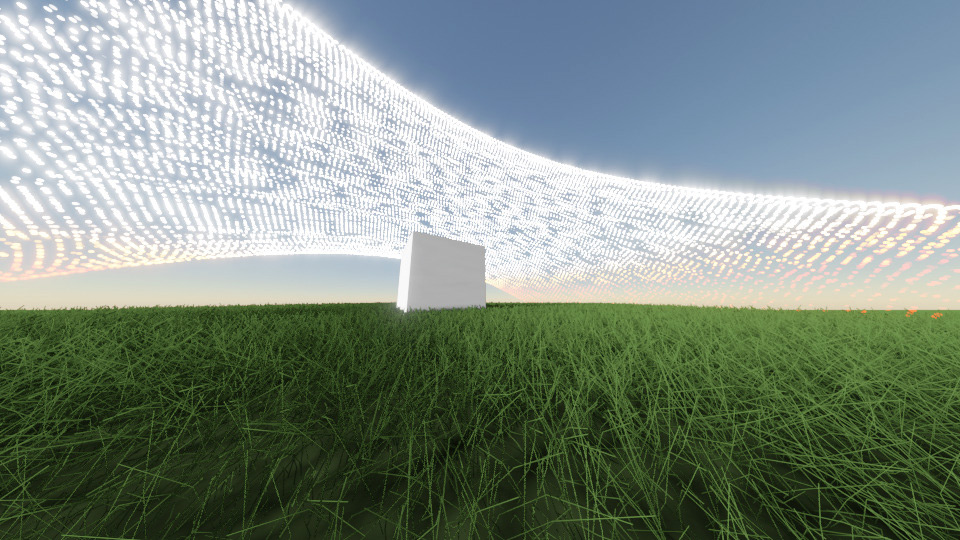
Rather than generate 365 images and stack them, possibly dealing with frustrating dynamic range issues in the process, it made more sense to render the analemma as a single frame. I replaced the sun with 365 individual miniature suns, one for each day of 2023.
Our first analemmagraph!
I suppose it's the same as watching a day-long timelapse, or 365 day-long timelapses superimposed on each other.
Two immediate problems spring to mind. We haven't accounted for atmospheric refraction at all, which makes the sunset disconcertingly white. It also means our positioning is slightly off, as refraction changes the apparent position of the sun. As a first-order correction, I made a colour-map to each sun's effective Z position that dims it to yellow and red.
The second problem is that we've no weather. As clouds go by, the sun disappears and the suntrails should become splotchy as a result. My very simple solution, just to get a feel of it, is to add a random flicker to each of them (based on object index and frame number, fed into a sine function).
I also switched to eevee as the rendering engine. It takes a lot of work to get things like shadows to look right in eevee, our grass now looks very artificial, but the speedup in rendering times is ridiculous, averaging less than one second per frame. If we can render quickly we can play around a bit more.
Eevee can't cast shadows from emissive objects, only from lights. Trying to parent 365 lights to 365 animated miniature suns seemed to make it quite upset. Instead, the lighting is provided by a single invisible rectangle that tags along with the analemma.
Another inaccuracy in this simulation is that the sky texture isn't a year-long average. I set the sky texture to follow the equinox as a compromise, but really it should be a mix of sunsets at different times. I'm not sure what the fastest way to fix this would be, short of rendering out thousands of images and averaging them. It may be possible to adjust the model, but I didn't dig that deep.
I was more concerned about trying to capture that ethereal distortion in the solargraphs. We can easily add lens distortion in the compositor, here's a smidge of pincusion:
Or, even more absurd, we can set our rectilinear camera projection to be an impossibly wide 2mm (on a 35mm sensor).
As bonkers as it looks, it's not really what we were going for.
One thing to remember is that it is all distortion of our projection. The analemma, if you were to trace out the path of the sun on the surface of the planet, is the same shape for any time of day.
I was surprised that the sun position add-on is able to plot analemmas. A ring of analemmas (one for each hour) is sometimes called a wreath. The add-on can plot this, and you can get a real feel for how it behaves by varying the latitude.
The dashed blue line represents north.
An analemmagraph in the southern hemisphere shows the figure-eight upside-down. Here the latitude's set to -51°:
Back to the fisheye projection, and Cycles (raytracing), I rendered another analemmagraph with the improved sun behaviour.
Analemma timelapse
Another visualisation we can make, while we're blending ideas, is a straight-forward analemma timelapse. An image of the sun at a fixed time each day for a full year. To make it a little interesting I set the latitude to 61°, not quite reaching the arctic circle (which would be 66°)
The analemma above is at noon. I didn't simulate any weather. I also think that, if it's a year-long timelapse, we should have added some deciduous trees to show the seasons. Perhaps snowfall. Perhaps not. At the very least the grass should grow, and be mown as necessary.
Suntrail timelapse
Reinterpreting the same data again, we could plot a timelapse of day-long exposures. Each day has a streak of sun across the sky (assuming no clouds) and the streak bounces back and forth with the seasons.Here the projection is rectilinear at 5mm.
I didn't bother simulating weather or refraction, and the sky texture is just approximate. But I ask you, dear reader, to imagine what such a timelapse would look like if it were plotted with real data. Real clouds, real grass, real imperfections, real limitations due to the dynamic range.
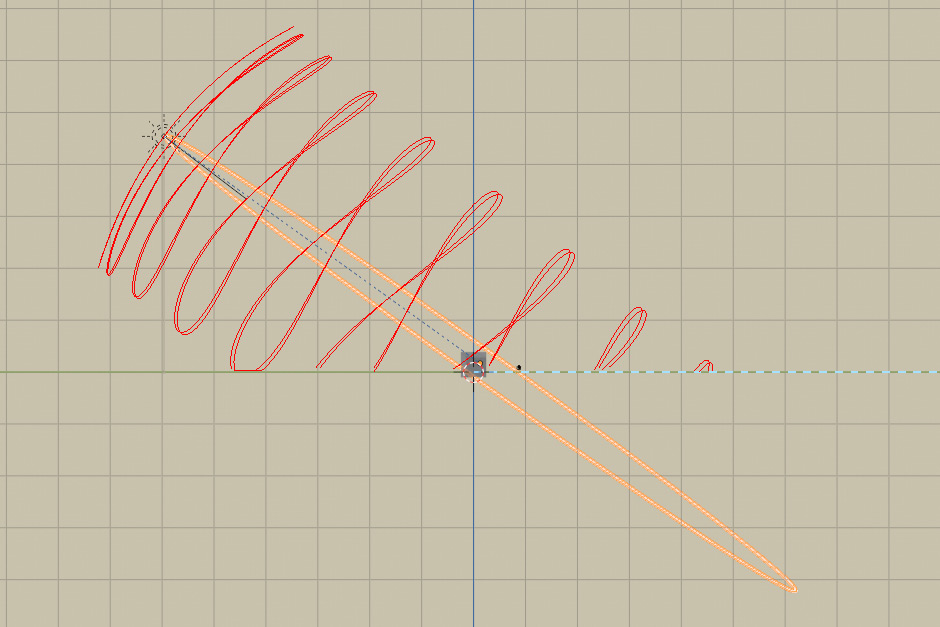
The suntrail timelapse was produced by making an illuminated torus and constraining it to follow the sun position. Here's a behind-the-scenes look at that process, where it's not yet aligned:
Solargraph
As it consists of the same data, an analemmagraph can be squished into a solargraph by averaging all the frames. This makes use of the entire year's data, rather than solstice-to-solstice, but the result should be similar.In actuality, because of our limited dynamic range, averaging all of the frames results in no visible sun trails. The frames are bright enough to make out details in the image, that means the sun is a uselessly blown highlight. The pixel value of the sun is saturated at 255, when it should be something a thousand times that.
Instead of averaging, we can take the maximum pixel value. This gives us clear sun trails and a very blown-out image. To soften it a little we can then overlay it onto the average.
This is a pretty good indicator of how inaccurate my weather simulation was. A more realistic output would have entire days being cloudy, rather than the momentary clouds that seem to exist in the above. The dottiness is due to the limited number of frames, the video uses 250 frames to represent 18 hours. A real solargraph is a continuous exposure. I think 500 or 1000 frames would probably be enough to smooth things out. It's also entirely possible I didn't set the angular size of the sun correctly. The fisheye lens is the most forgiving for this, narrower angles of view will make the discrete sun images more apparent.
Instead of generating more images, it would be better to try and generate interpolated sun shapes, to fill the gaps between them.
The command to average a whole load of images with ImageMagick is: convert *.png -evaluate-sequence mean out.png You can replace the "mean" operation with "max" or a bunch of other operations.
Amulet
To finish off, let's import that old sun-sensitive project of mine, the UV Protection Amulet.
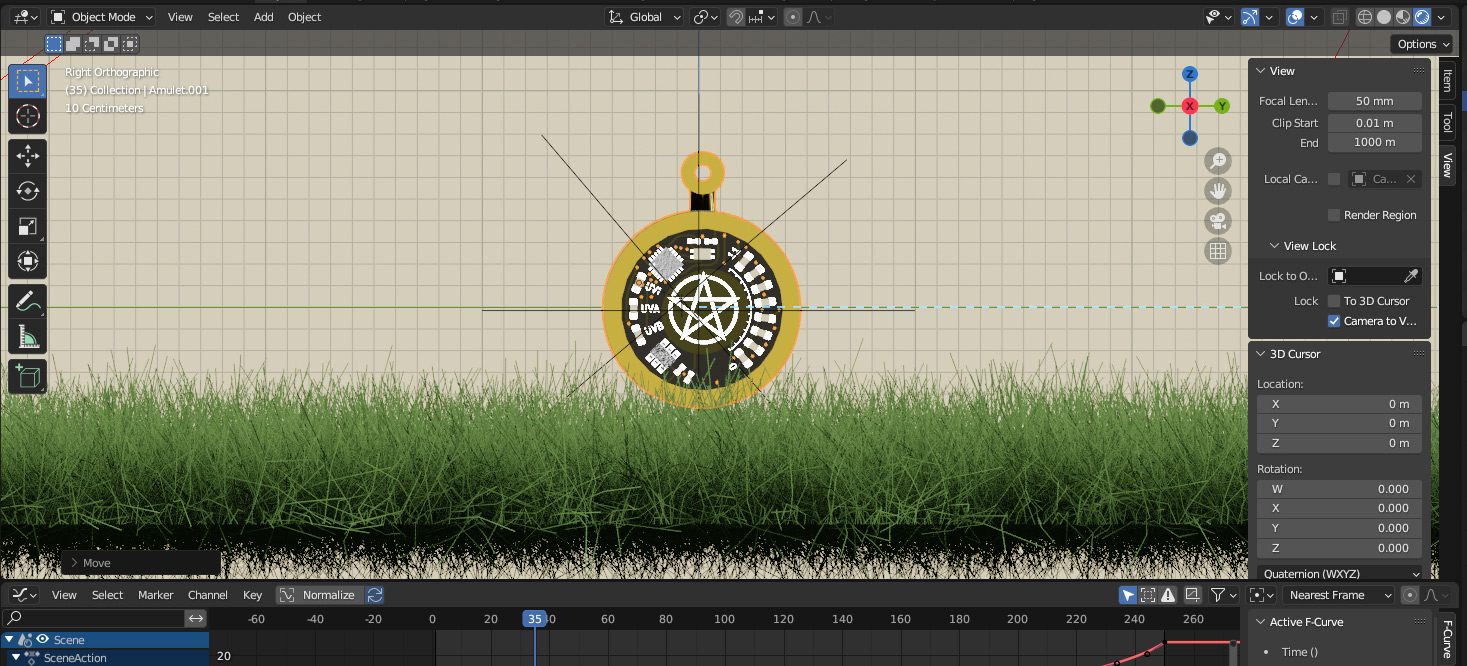
Gosh I do love playing around in Blender.
(I time-stretched that one a little to lengthen the sunset.)
Another thing that's very easy in simulation is a dolly shot. It would be possible with a robotic motorised slider. You'd have to run the same dolly shot every day. Capturing sunrise and sunset without a superwide lens would certainly be something.
Conclusion
While admittedly straight-forward, there is something quite satisfying about taking a video and slicing it in different ways to produce interesting visualisations. As previously mentioned, I have another (currently unposted) project revolving around a similar idea. Getting dramatic results by reinterpreting mundane data ("mundata") is particularly pleasing. It can be a new way of looking at the world.
If anyone has a year of data that we could use to try and produce some of these visualisations for real, I'd love to take a stab at it. Failing that, if anyone has a view that could be used to take a nice year-long timelapse, I'd be keen to help turn it into reality. If it's digital, and a full year, we don't even need to start at the solstice.